Discover the critical metrics scientists use to track the Earth’s changing climate in our eye-opening article, “Decoding Climate Change: The Key Metrics You Need to Know.” From rising sea levels to shrinking ice caps, we break down the data behind our planet’s most pressing issue. Uncover what these numbers really mean for our future and why monitoring them is crucial for driving meaningful action against climate change.
Atmospheric CO2 levels, global temperature, sea level rise, and ice extent – these key indicators paint a vivid picture of the profound impact human activities are having on our planet. Join us as we explore the science behind each metric, revealing the startling trends that define the climate crisis. Through compelling visuals and expert insights, we make complex data accessible and meaningful for all.
In a world awash with climate change information, our article cuts through the noise to deliver a clear, concise understanding of the most critical metrics. Gain the knowledge you need to become an informed advocate for our planet’s future. Don’t miss this essential guide to the numbers that matter most in the fight against climate change.
Temperature Metrics
Global Average Temperature
The global average temperature, calculated using measurements from land and ocean surfaces, serves as a key indicator of Earth’s changing climate. Scientists analyze temperature data collected by weather stations, ships, buoys, and satellites to determine long-term trends. Since the late 19th century, the global average temperature has risen by approximately 1.1°C (2°F), with most of this warming occurring in the past 40 years. The five warmest years on record have all occurred since 2015, highlighting the accelerating pace of climate change. This seemingly small rise in temperature can have far-reaching consequences, such as more frequent and intense heatwaves, melting glaciers and ice sheets, rising sea levels, and changes in precipitation patterns. By monitoring global average temperature, scientists can track the progress of climate change and inform decision-makers about the urgent need for mitigation and adaptation strategies.
Temperature Anomalies
Temperature anomalies, or departures from long-term averages, are a key metric for tracking climate change. Scientists compare current temperatures to baseline data, usually from 1951-1980, to determine how much warming has occurred. Positive anomalies indicate temperatures above the average, while negative anomalies signify cooler-than-normal conditions.
By analyzing global temperature anomalies, researchers can identify warming trends over time. For example, NASA data shows that the Earth’s average surface temperature has risen about 1.18°C (2.12°F) since the late 19th century, with most of the warming occurring in the past 40 years. This warming is largely attributed to increased greenhouse gas emissions from human activities.
Temperature anomalies also help scientists detect regional variations in climate change. While global temperatures are rising overall, some areas may experience more rapid warming than others, leading to local impacts such as heatwaves, droughts, or melting permafrost. By monitoring temperature anomalies at different scales, researchers can better understand and prepare for the diverse consequences of a changing climate.
Extreme Temperature Events
Extreme temperature events, such as heat waves and cold snaps, are becoming more frequent and intense due to climate change. Scientists track these events using various temperature-related metrics, including the number of days above or below certain thresholds and the duration of such events. By analyzing historical data and monitoring current trends, researchers can identify patterns and project future changes in the frequency and severity of extreme temperatures. This information is crucial for developing strategies to protect public health, agriculture, and infrastructure from the impacts of increasingly common and prolonged periods of extreme heat or cold.

Greenhouse Gas Metrics
Carbon Dioxide (CO2)
Carbon dioxide (CO2) is the most significant long-lived greenhouse gas contributing to climate change. Its atmospheric concentration has risen from pre-industrial levels of around 280 parts per million (ppm) to over 410 ppm today, primarily due to human activities. The main sources of CO2 emissions include burning fossil fuels like coal, oil, and natural gas for energy production, transportation, and industrial processes. Deforestation and land-use changes also contribute to CO2 emissions, as forests absorb and store carbon from the atmosphere. As CO2 levels continue to rise, it traps more heat in the Earth’s atmosphere, leading to global warming and climate change. The long atmospheric lifetime of CO2, which can remain in the atmosphere for hundreds to thousands of years, makes it a critical factor in long-term climate change. Reducing CO2 emissions through transitioning to renewable energy sources, improving energy efficiency, and protecting and restoring forests is crucial for mitigating climate change and its impacts on our planet. By monitoring CO2 levels and understanding its sources, scientists can better inform policymakers and the public about the urgent need for action to address this global challenge.
Methane (CH4)
Methane (CH4) is a potent greenhouse gas that contributes significantly to climate change, despite its shorter atmospheric lifetime compared to carbon dioxide. Agriculture, particularly livestock farming and rice cultivation, is a major source of methane emissions due to the digestive processes of ruminant animals and anaerobic decomposition in flooded rice fields. Landfills also generate substantial amounts of methane as organic waste decomposes without oxygen. The extraction, processing, and distribution of fossil fuels, such as coal, oil, and natural gas, further contribute to methane emissions through leaks and intentional venting. Although methane breaks down in the atmosphere more quickly than carbon dioxide, its global warming potential is 28-36 times higher over a 100-year period, making it a critical target for emissions reduction efforts. Mitigating methane emissions through improved agricultural practices, landfill management, and leak detection in fossil fuel infrastructure is essential for combating climate change in the near term.
Nitrous Oxide (N2O)
Nitrous oxide (N2O), a potent greenhouse gas, has a global warming potential nearly 300 times greater than carbon dioxide over a 100-year period. Although its atmospheric concentration is lower than CO2, N2O has a significant impact on climate change due to its long atmospheric lifetime of around 114 years. Agriculture is the primary source of N2O emissions, with nitrogen-based fertilizers and manure management contributing to its release. Industrial processes, such as the production of nitric acid and adipic acid, also generate N2O. Natural sources, including soil and oceans, play a role in N2O emissions as well. As global temperatures rise due to the impacts of climate change, the release of N2O from these sources is expected to increase, creating a positive feedback loop that further amplifies warming. Reducing N2O emissions through improved agricultural practices and industrial efficiency is crucial for mitigating climate change.
Sea Level and Ice Metrics
Sea Level Rise
One key metric for tracking the impacts of climate change is sea level rise. As the Earth warms, ocean waters expand and land-based ice melts, causing global average sea levels to increase. Scientists use various methods, such as satellite altimetry and tide gauges, to precisely measure these changes over time. Recent data shows that the rate of sea level rise has accelerated in recent decades, with global mean sea level increasing by about 3.4 millimeters per year. This trend is expected to continue, with projections suggesting a potential rise of 0.3 to 1.1 meters by 2100, depending on greenhouse gas emission scenarios. Rising seas pose significant risks to coastal communities, infrastructure, and ecosystems worldwide. By carefully monitoring changes in sea level, scientists can better understand the pace and severity of climate change impacts and inform adaptation strategies to protect vulnerable areas.
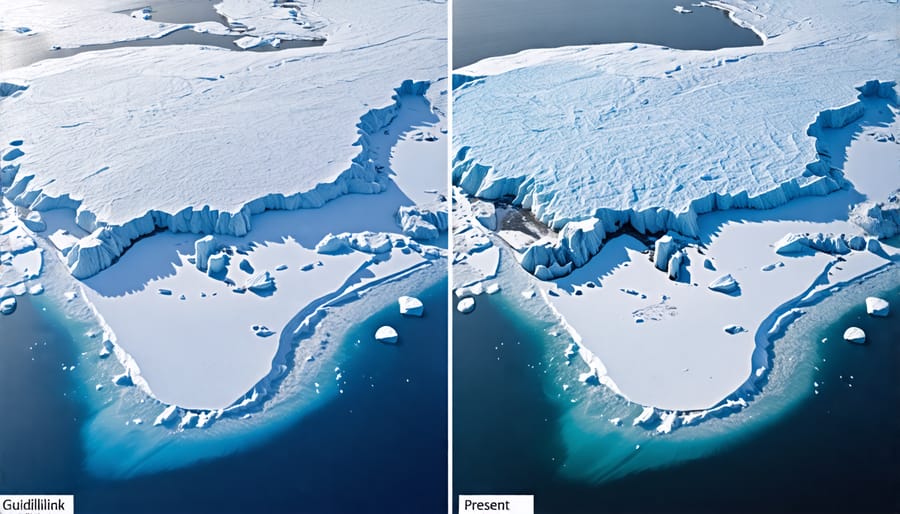
Sea Ice Extent
Sea ice extent, the area of ocean covered by sea ice, serves as a critical indicator of climate change in the polar regions. Scientists closely monitor the seasonal fluctuations and long-term trends in both Arctic and Antarctic sea ice using satellite imagery. In the Arctic, sea ice reaches its minimum extent in September and its maximum in March, while the opposite is true for the Antarctic. Over the past few decades, Arctic sea ice extent has shown a significant decline, particularly during the summer months. This reduction in sea ice coverage has far-reaching consequences, from amplifying regional warming to altering marine ecosystems and affecting global weather patterns. In contrast, Antarctic sea ice extent has shown more variability, with some regions experiencing increases while others have seen declines. Tracking changes in sea ice extent is crucial for understanding the impacts of climate change on the polar regions and the global climate system as a whole.
Conclusion
Climate change metrics play a vital role in our understanding and response to the global climate crisis. By quantifying key indicators like temperature, sea level rise, and greenhouse gas concentrations, these metrics provide an objective basis for assessing the state of our planet and the effectiveness of mitigation efforts. This data is essential for driving action at all levels, from individual lifestyle changes to international policy decisions.
Moreover, climate change metrics serve as a powerful tool for holding governments, businesses, and society as a whole accountable for their environmental impact. By setting clear targets and tracking progress against them, we can ensure that commitments to reduce emissions and adapt to a changing climate are being met. This transparency is crucial for building trust and ensuring accountability in the fight against climate change.
As we look to the future, the continued development and refinement of climate change metrics will be essential for guiding our efforts to build a more sustainable and resilient world. By providing a clear and compelling picture of the challenges we face, these metrics can inspire the urgent action needed to secure a livable planet for generations to come.
Resources
Here are some reliable resources for tracking and understanding climate change metrics:
NASA’s Global Climate Change website offers a wealth of data, interactive visualizations, and educational content on key climate indicators like global temperature, Arctic sea ice extent, and carbon dioxide levels. Their regularly updated Vital Signs of the Planet dashboard is an excellent starting point.
The NOAA Climate at a Glance tool enables users to easily analyze and visualize climate trends at global, national, and state levels. The platform covers temperature, precipitation, and drought data over various time scales.
For a global perspective, the Intergovernmental Panel on Climate Change (IPCC) provides comprehensive assessment reports and special reports that synthesize the latest scientific findings on climate change. Their publications are widely regarded as the most authoritative sources on the subject.
The U.S. Environmental Protection Agency’s Climate Change Indicators portal tracks over 50 indicators related to greenhouse gases, weather and climate, oceans, snow and ice, and ecosystems. Each indicator is presented with clear explanations and downloadable data sets.
Lastly, the World Resources Institute’s Climate program offers insightful articles, data visualizations, and interactive tools that help users understand the impacts of climate change and explore potential solutions. Their content spans energy, transportation, land use, and more.